kg_charts
kg_charts icon library. At present, there are only radar charts. Other types of charts may be added later
Start
dependencies:
  kg_charts: ^0.0.4
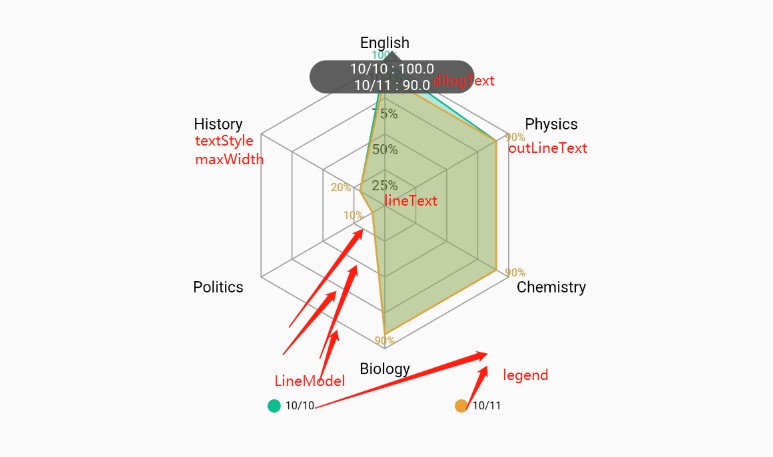
The effect of radar chart is as follows


caption

Usage example:
RadarWidget(
            radarMap: RadarMapModel(
                legend: [
                  LegendModel('10/10',const Color(0XFF0EBD8D)),
                  LegendModel('10/11',const Color(0XFFEAA035)),
                ],
                indicator: [
                  IndicatorModel("English",100),
                  IndicatorModel("Physics",100),
                  IndicatorModel("Chemistry",100),
                  IndicatorModel("Biology",100),
                  IndicatorModel("Politics",100),
                  IndicatorModel("History",100),
                ],
                data: [
                  //   MapDataModel([48,32.04,1.00,94.5,19,60,50,30,19,60,50]),
                  //   MapDataModel([42.59,34.04,1.10,68,99,30,19,60,50,19,30]),
                  MapDataModel([100,90,90,90,10,20]),
                  MapDataModel([90,90,90,90,10,20]),
                ],
                radius: 130,
                duration: 2000,
                shape: Shape.square,
                maxWidth: 70,
                line: LineModel(4),
            ),
            textStyle: const TextStyle(color: Colors.black,fontSize: 14),
            isNeedDrawLegend: true,
            lineText: (p,length) =>  "${(p*100~/length)}%",
            dilogText: (IndicatorModel indicatorModel,List<LegendModel> legendModels,List<double> mapDataModels) {
              StringBuffer text = StringBuffer("");
              for(int i=0;i<mapDataModels.length;i++){
                text.write("${legendModels[i].name} : ${mapDataModels[i].toString()}");
                if(i!=mapDataModels.length-1){
                  text.write("\n");
                }
              }
              return text.toString();
            },
            outLineText: (data,max)=> "${data*100~/max}%",
          ),
Parameter Description:
| Parameter | type | necessary | description |
|---|---|---|---|
| radarMap | RadarMapModel | yes | includes legend, radar point, radar data, radius, radar type (round, square), maximum width of text, and several lines drawn inside (linemodel includes drawing line color, text size, etc. |
| textStyle | style | no | color and size of external drawing text |
| isNeedDrawLegend | bool | no | defalut true |
| lineText | fun | no | the text drawn on the internal line is dynamically generated according to the data. If it is empty, it will not be displayed |
| dilogText | fun | no | click the dialog that appears and generate it dynamically according to the data. If it is empty, it will not be displayed |
| outLineText | fun | no | the text drawn on the external line is dynamically generated according to the data. If it is empty, it will not be displaye |