Flutter Higcharts example
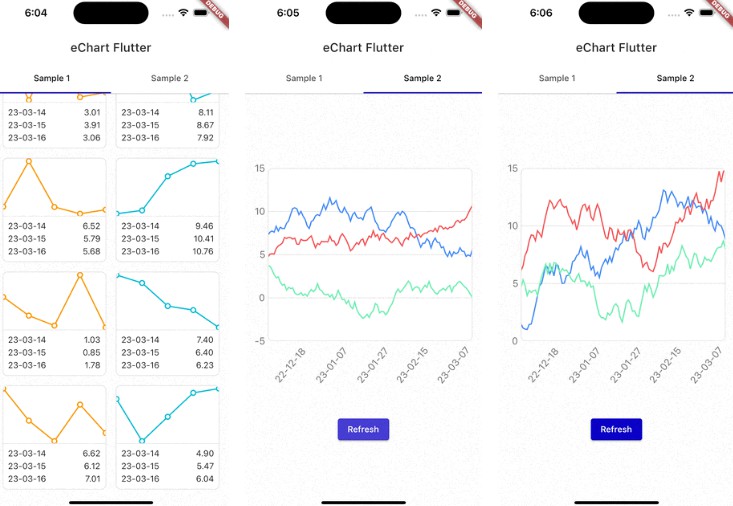
A flutter project by loading HighCharts locally using webviews and local js files (iOS & Android only). The assets/js folder contains the html and js files required. You might have to edit the chart js files for your needs
How data is loaded
//Chart data can be serialized to string from your data models
const xyValue = '''
      [{
        name: 'Installation & Developers',
        data: [43934, 48656, 65165, 81827, 112143, 142383,
            171533, 165174, 155157, 161454, 154610]
        }, {
            name: 'Manufacturing',
            data: [24916, 37941, 29742, 29851, 32490, 30282,
                38121, 36885, 33726, 34243, 31050]
        }, {
            name: 'Sales & Distribution',
            data: [11744, 30000, 16005, 19771, 20185, 24377,
                32147, 30912, 29243, 29213, 25663]
        }, {
            name: 'Operations & Maintenance',
            data: [null, null, null, null, null, null, null,
                null, 11164, 11218, 10077]
        }, {
            name: 'Other',
            data: [21908, 5548, 8105, 11248, 8989, 11816, 18274,
                17300, 13053, 11906, 10073]
        }]
''';
webViewController.runJavaScript('jsLineChartFunc($xyValue);');


