graphic
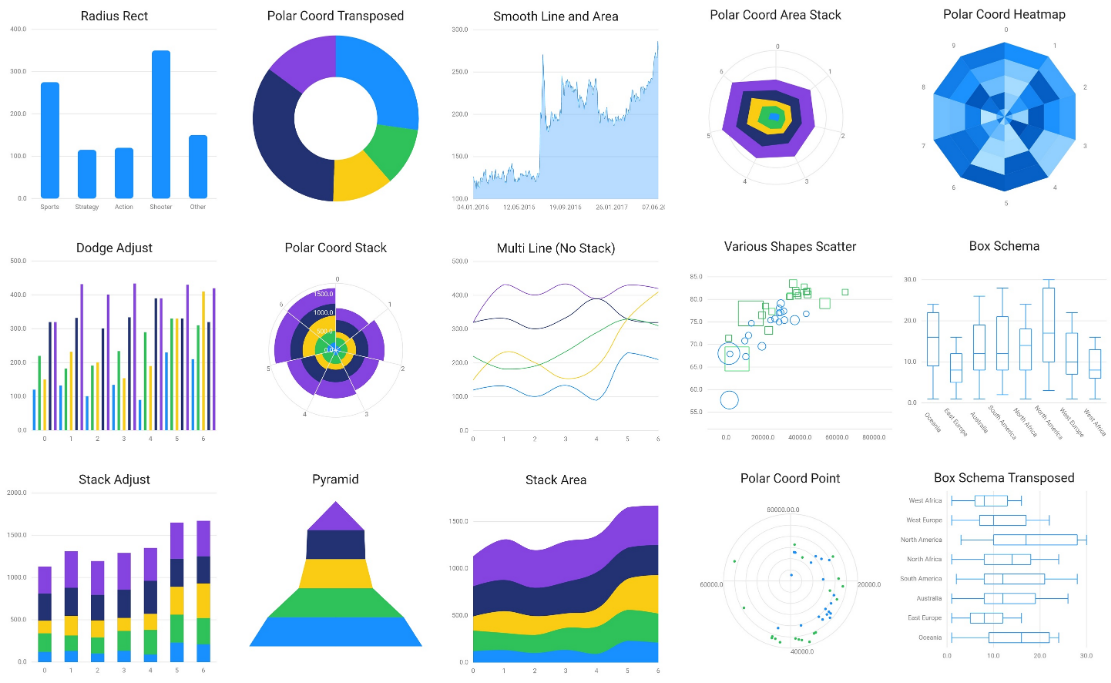
A Flutter data visualization library based on Grammar of Graphics.
Usage
Installing
Basic example
graphic.Chart(
  data: [
    { 'genre': 'Sports', 'sold': 275 },
    { 'genre': 'Strategy', 'sold': 115 },
    { 'genre': 'Action', 'sold': 120 },
    { 'genre': 'Shooter', 'sold': 350 },
    { 'genre': 'Other', 'sold': 150 },
  ],
  scales: {
    'genre': graphic.CatScale(
      accessor: (map) => map['genre'] as String,
    ),
    'sold': graphic.LinearScale(
      accessor: (map) => map['sold'] as num,
      nice: true,
    )
  },
  geoms: [graphic.IntervalGeom(
    position: graphic.PositionAttr(field: 'genre*sold'),
  )],
  axes: {
    'genre': graphic.Defaults.horizontalAxis,
    'sold': graphic.Defaults.verticalAxis,
  },
)
Document
If you have ever used data visualization libs based on Grammar of Graphics, such as AntV , ggplot2, you can be quite familiar with these concepts.
The document has not been written yet, but by referring to the Example App , I believe you can be smart enough to build your charts :)