Heatmap Calendar Flutter
Heatmap Calendar Flutter is a Flutter package inspired by the familiar GitHub contribution chart and the Flutter Heatmap Calendar.
It provides developers with two main components:
-
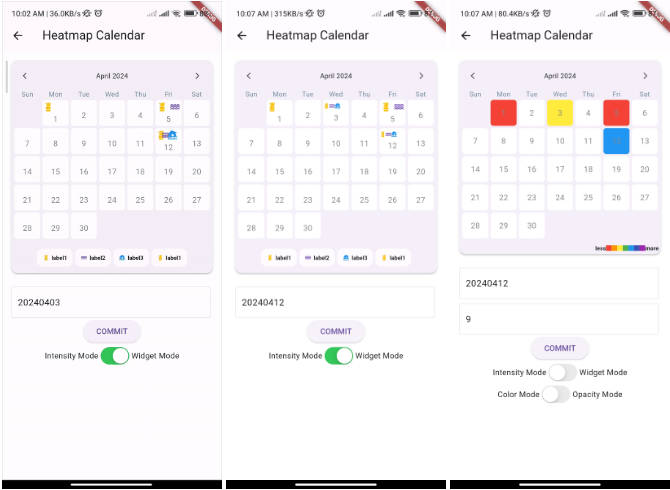
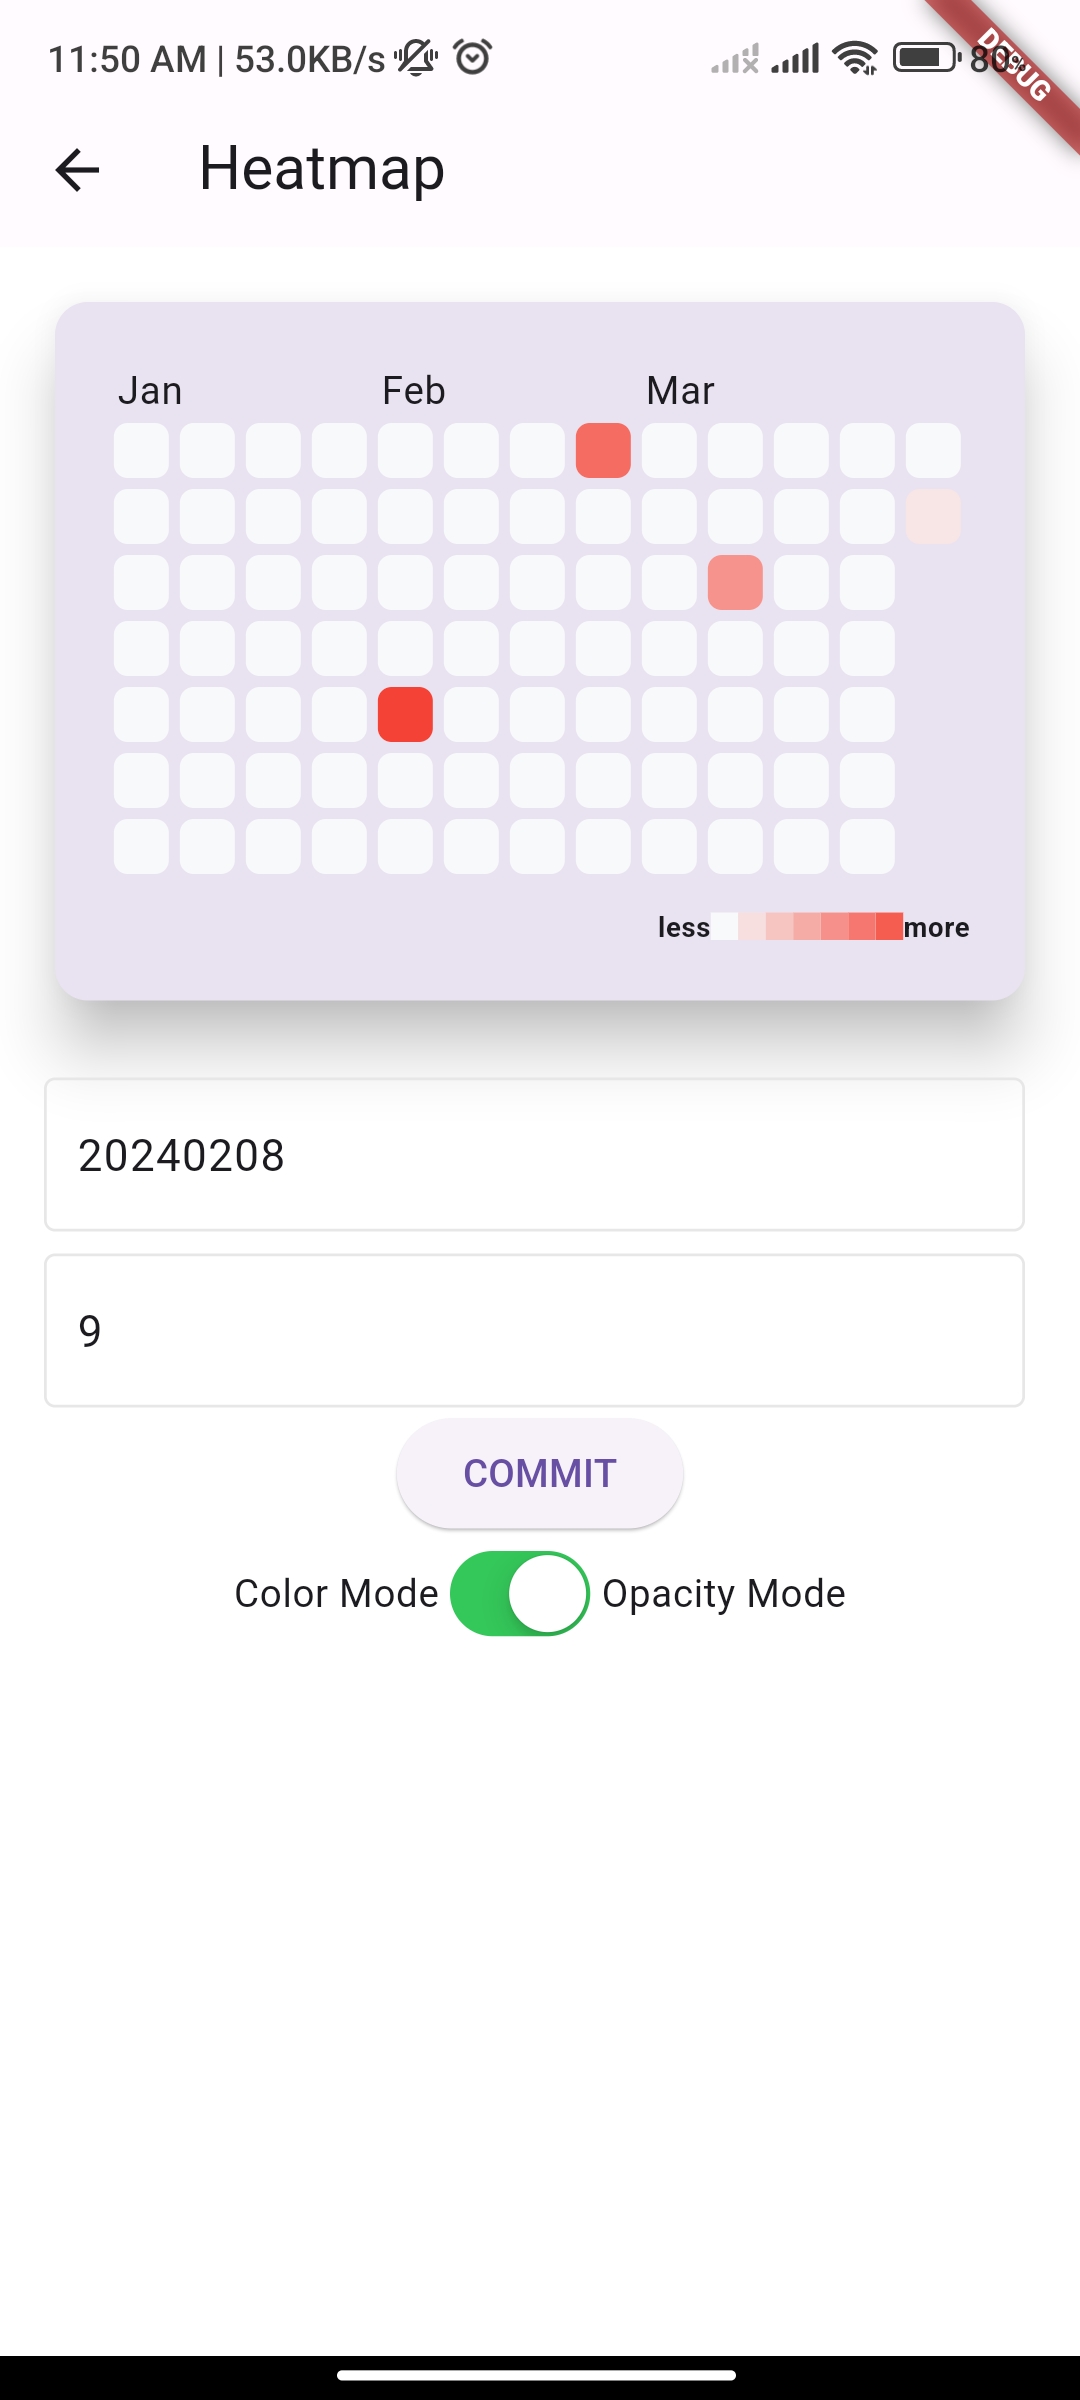
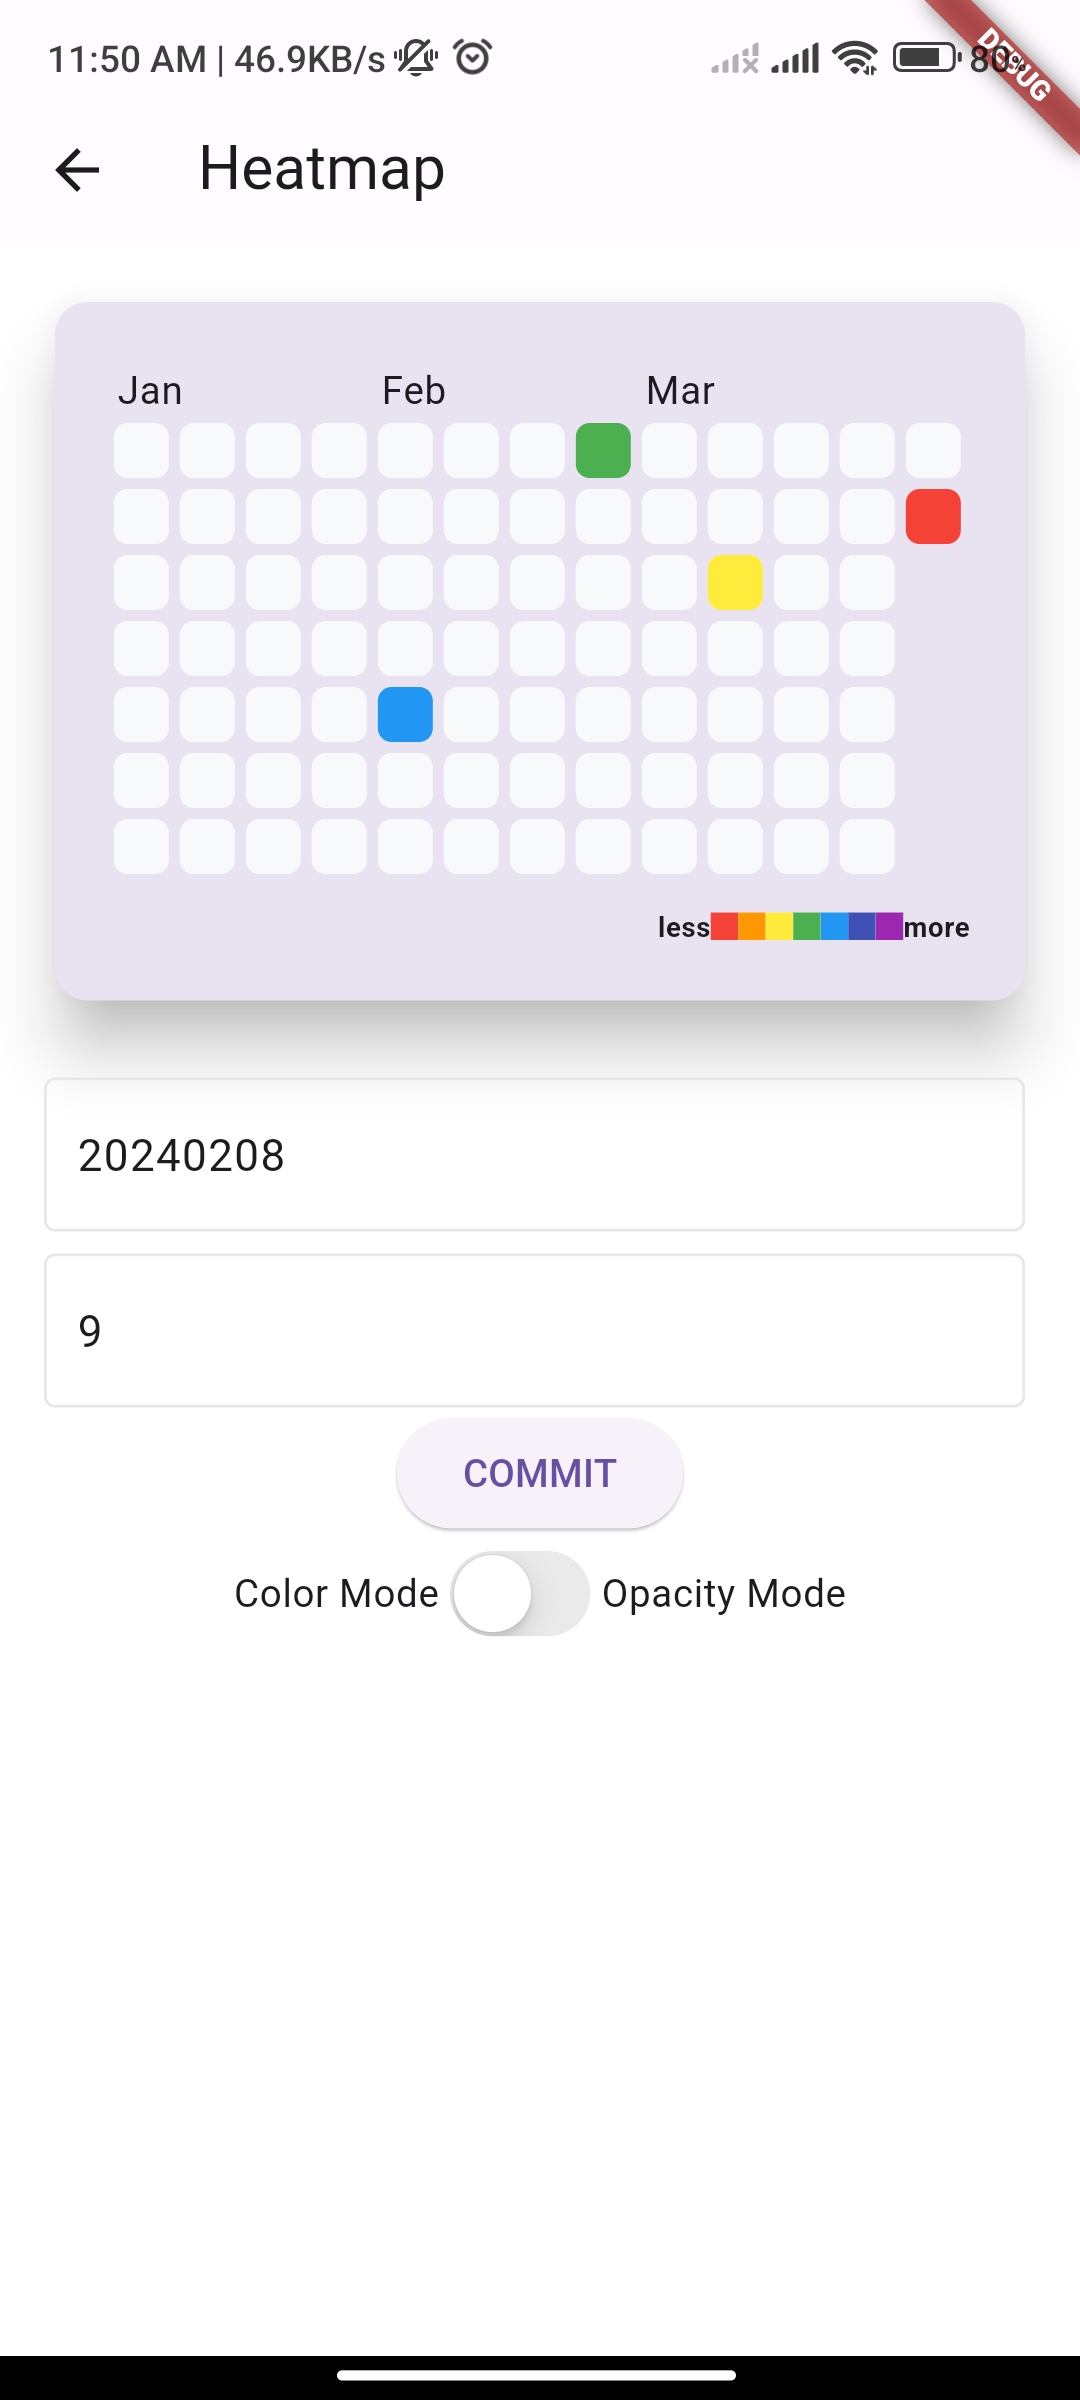
HeatMap: This component offers a traditional contribution chart that visualizes data using a heatmap-style representation. It's similar to the contribution chart seen on GitHub, where the intensity of the color represents the level of activity or contribution.
-
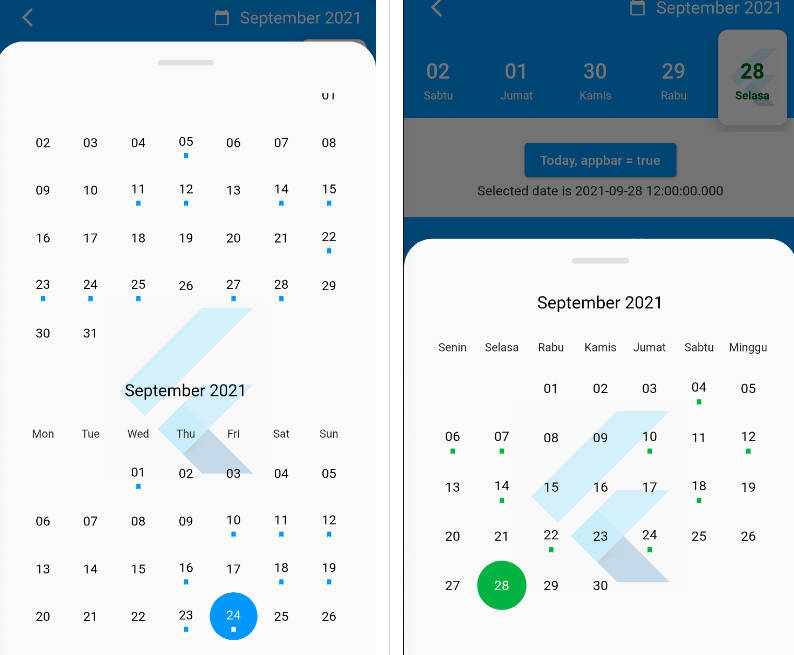
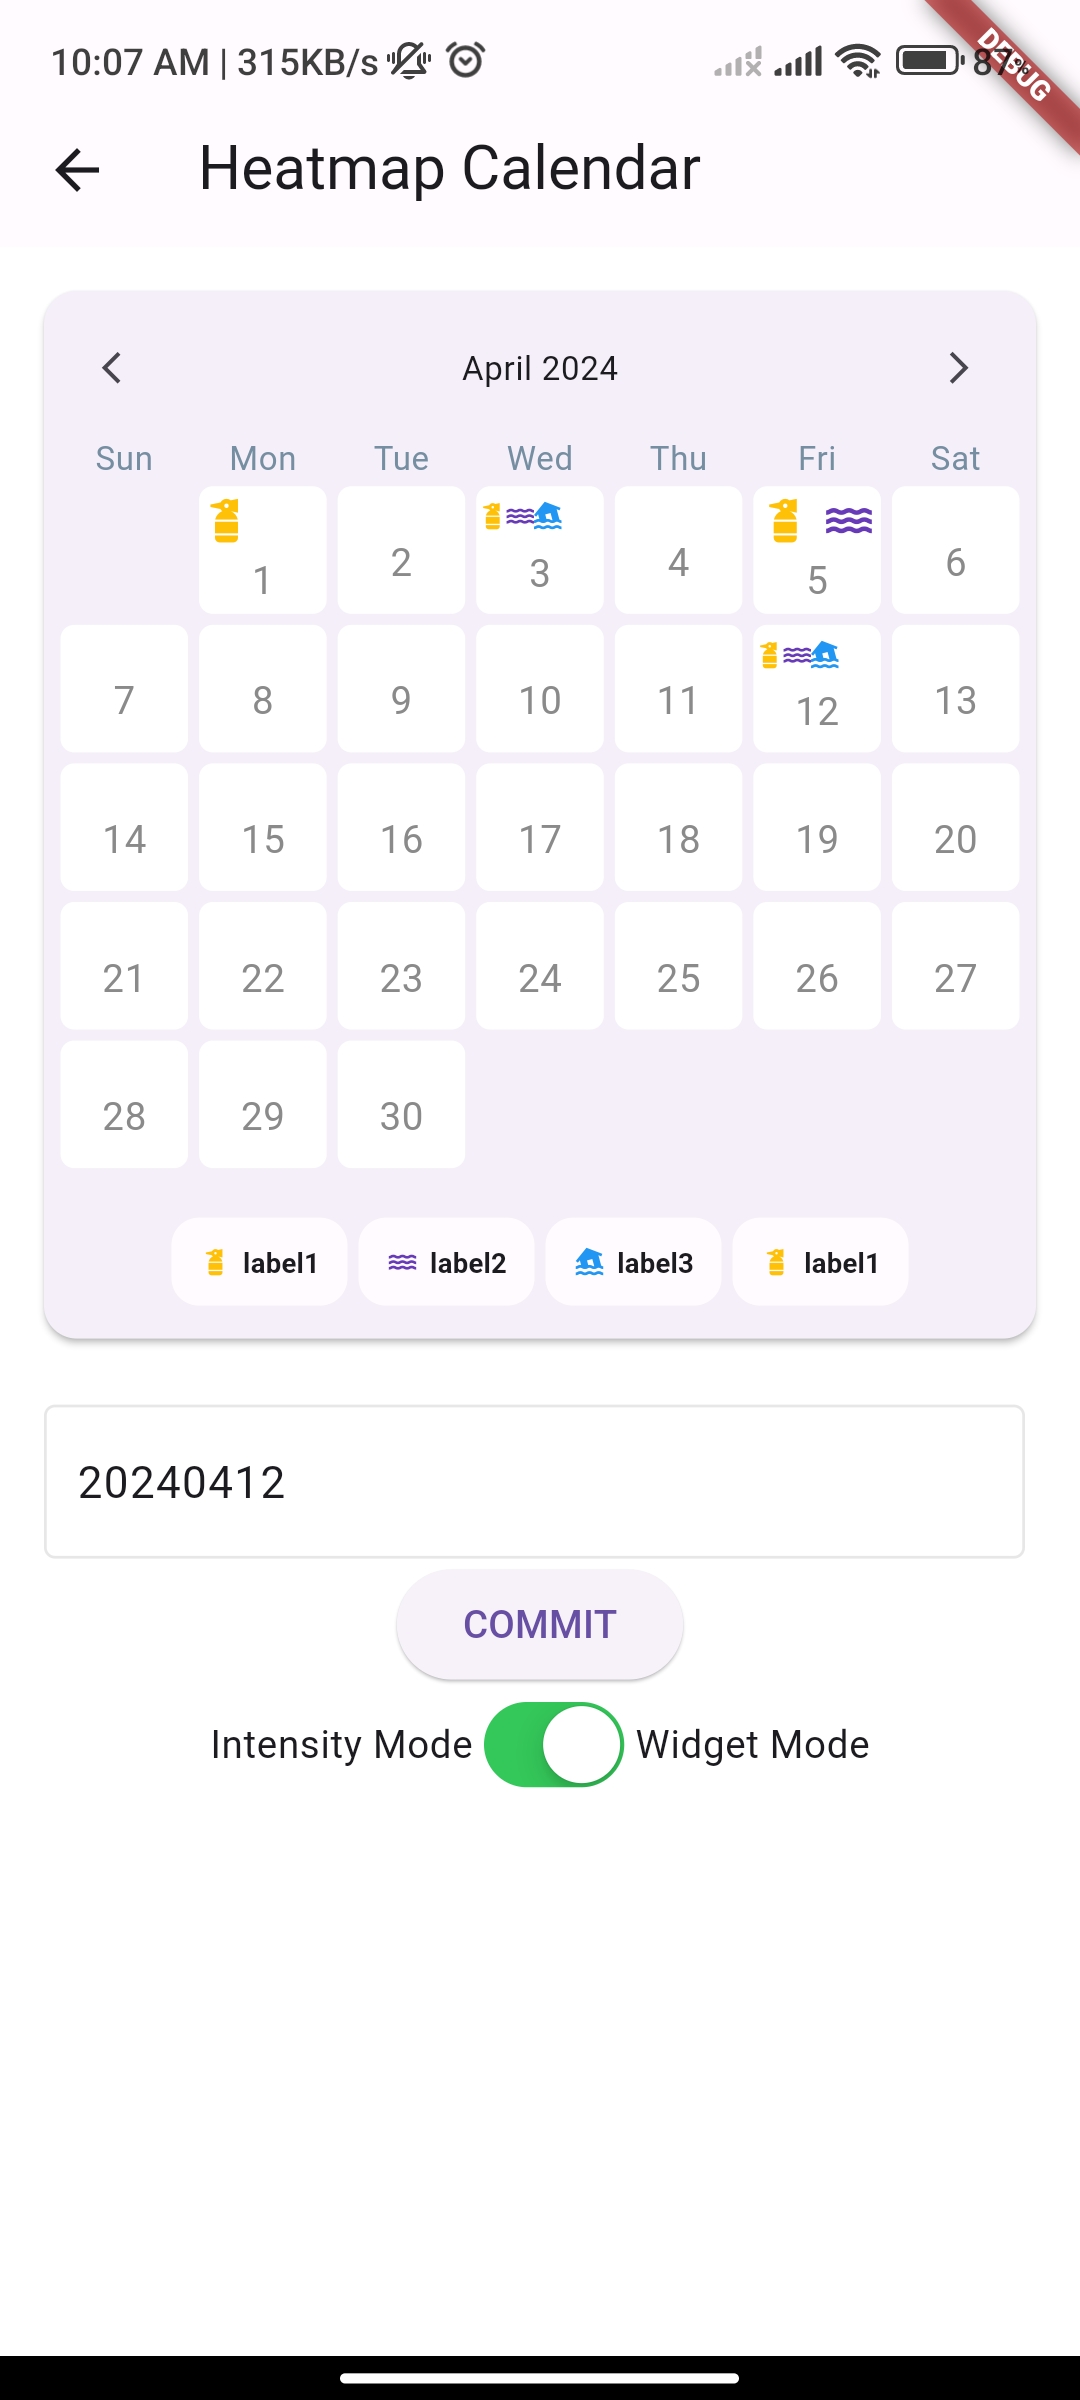
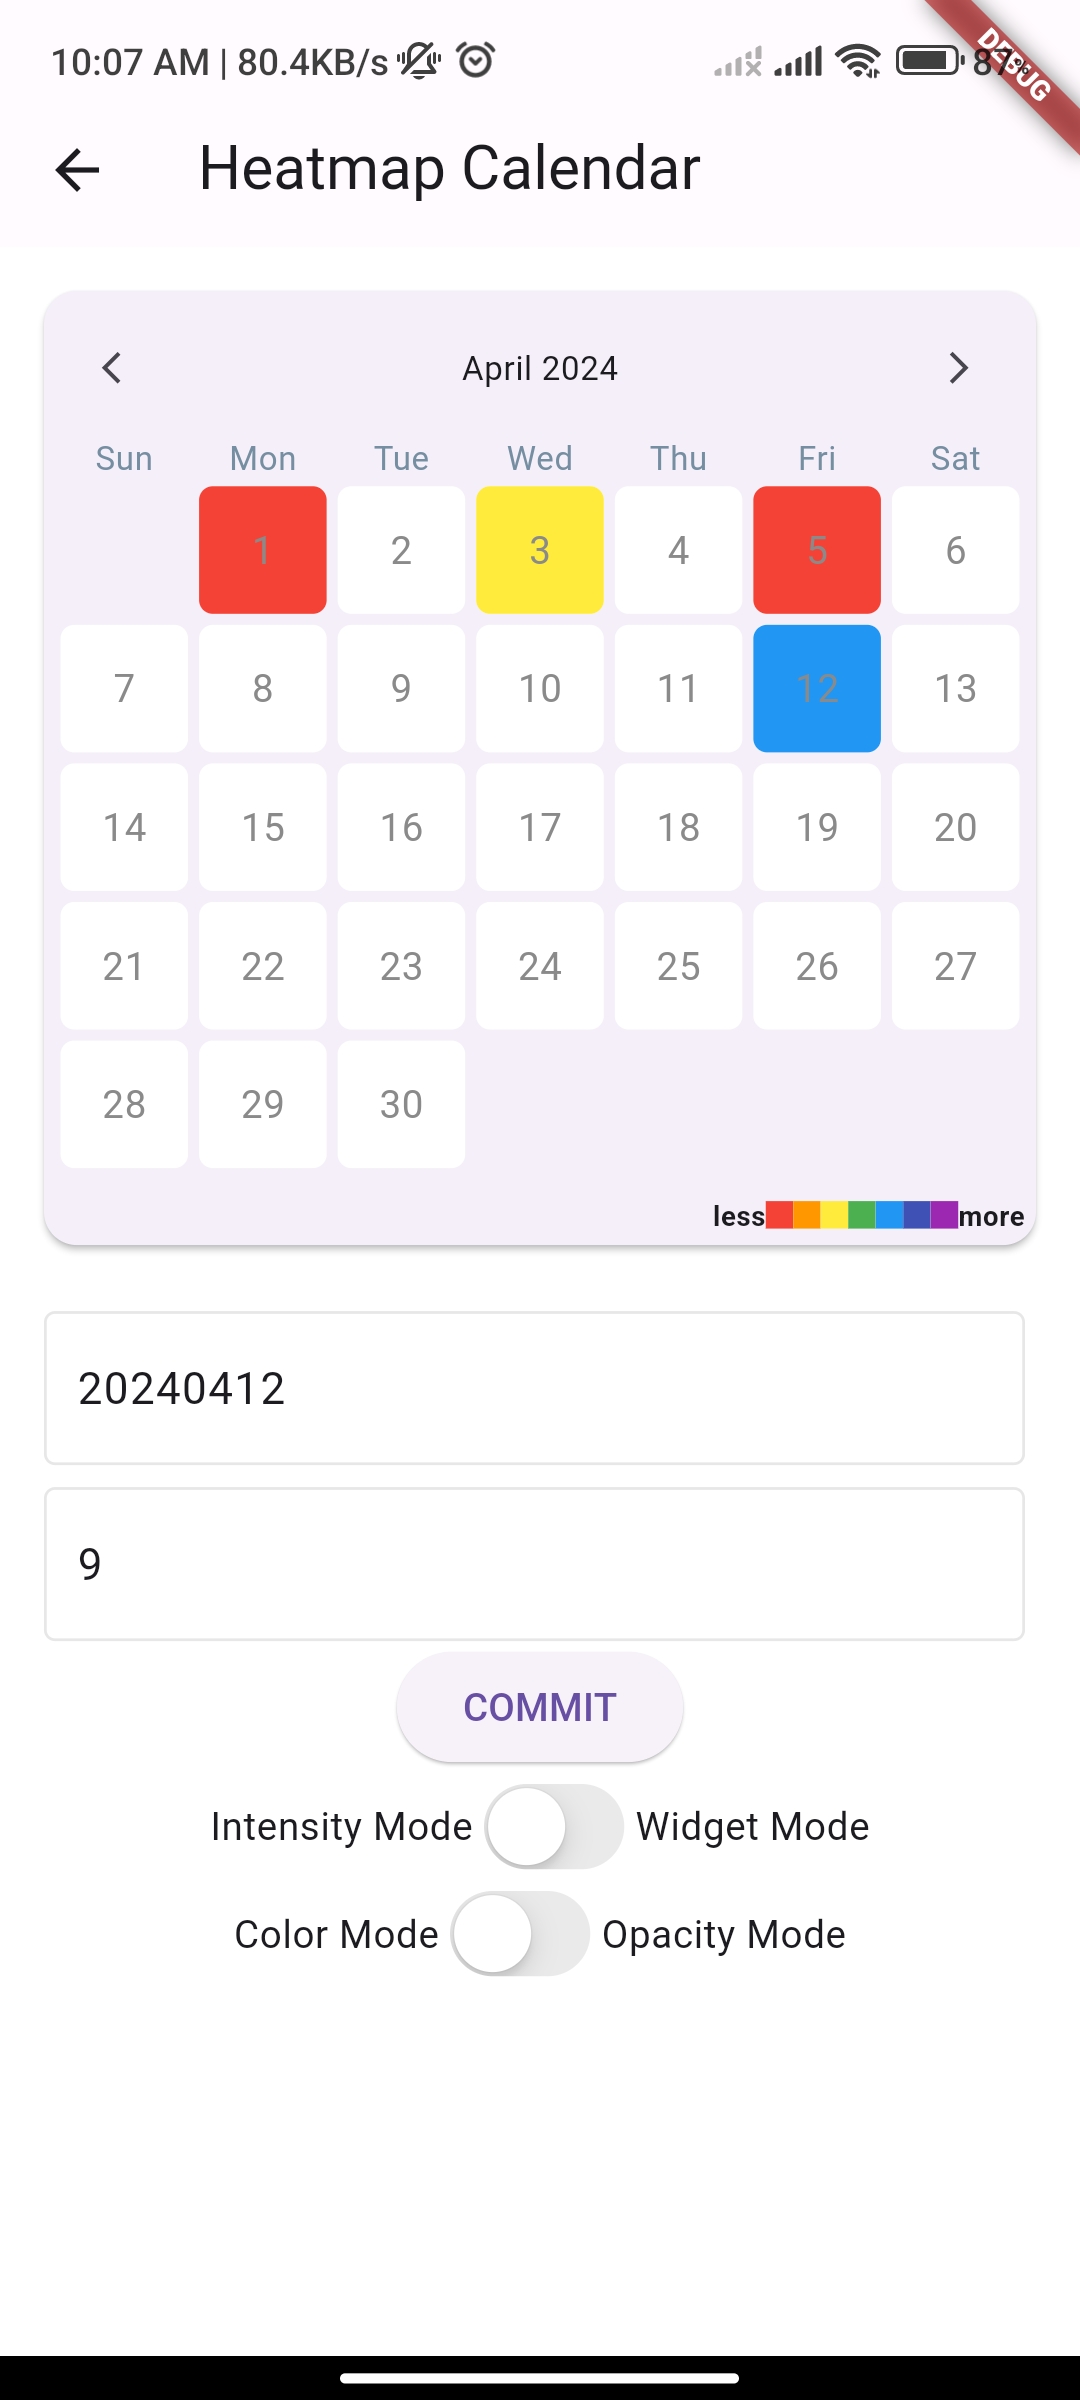
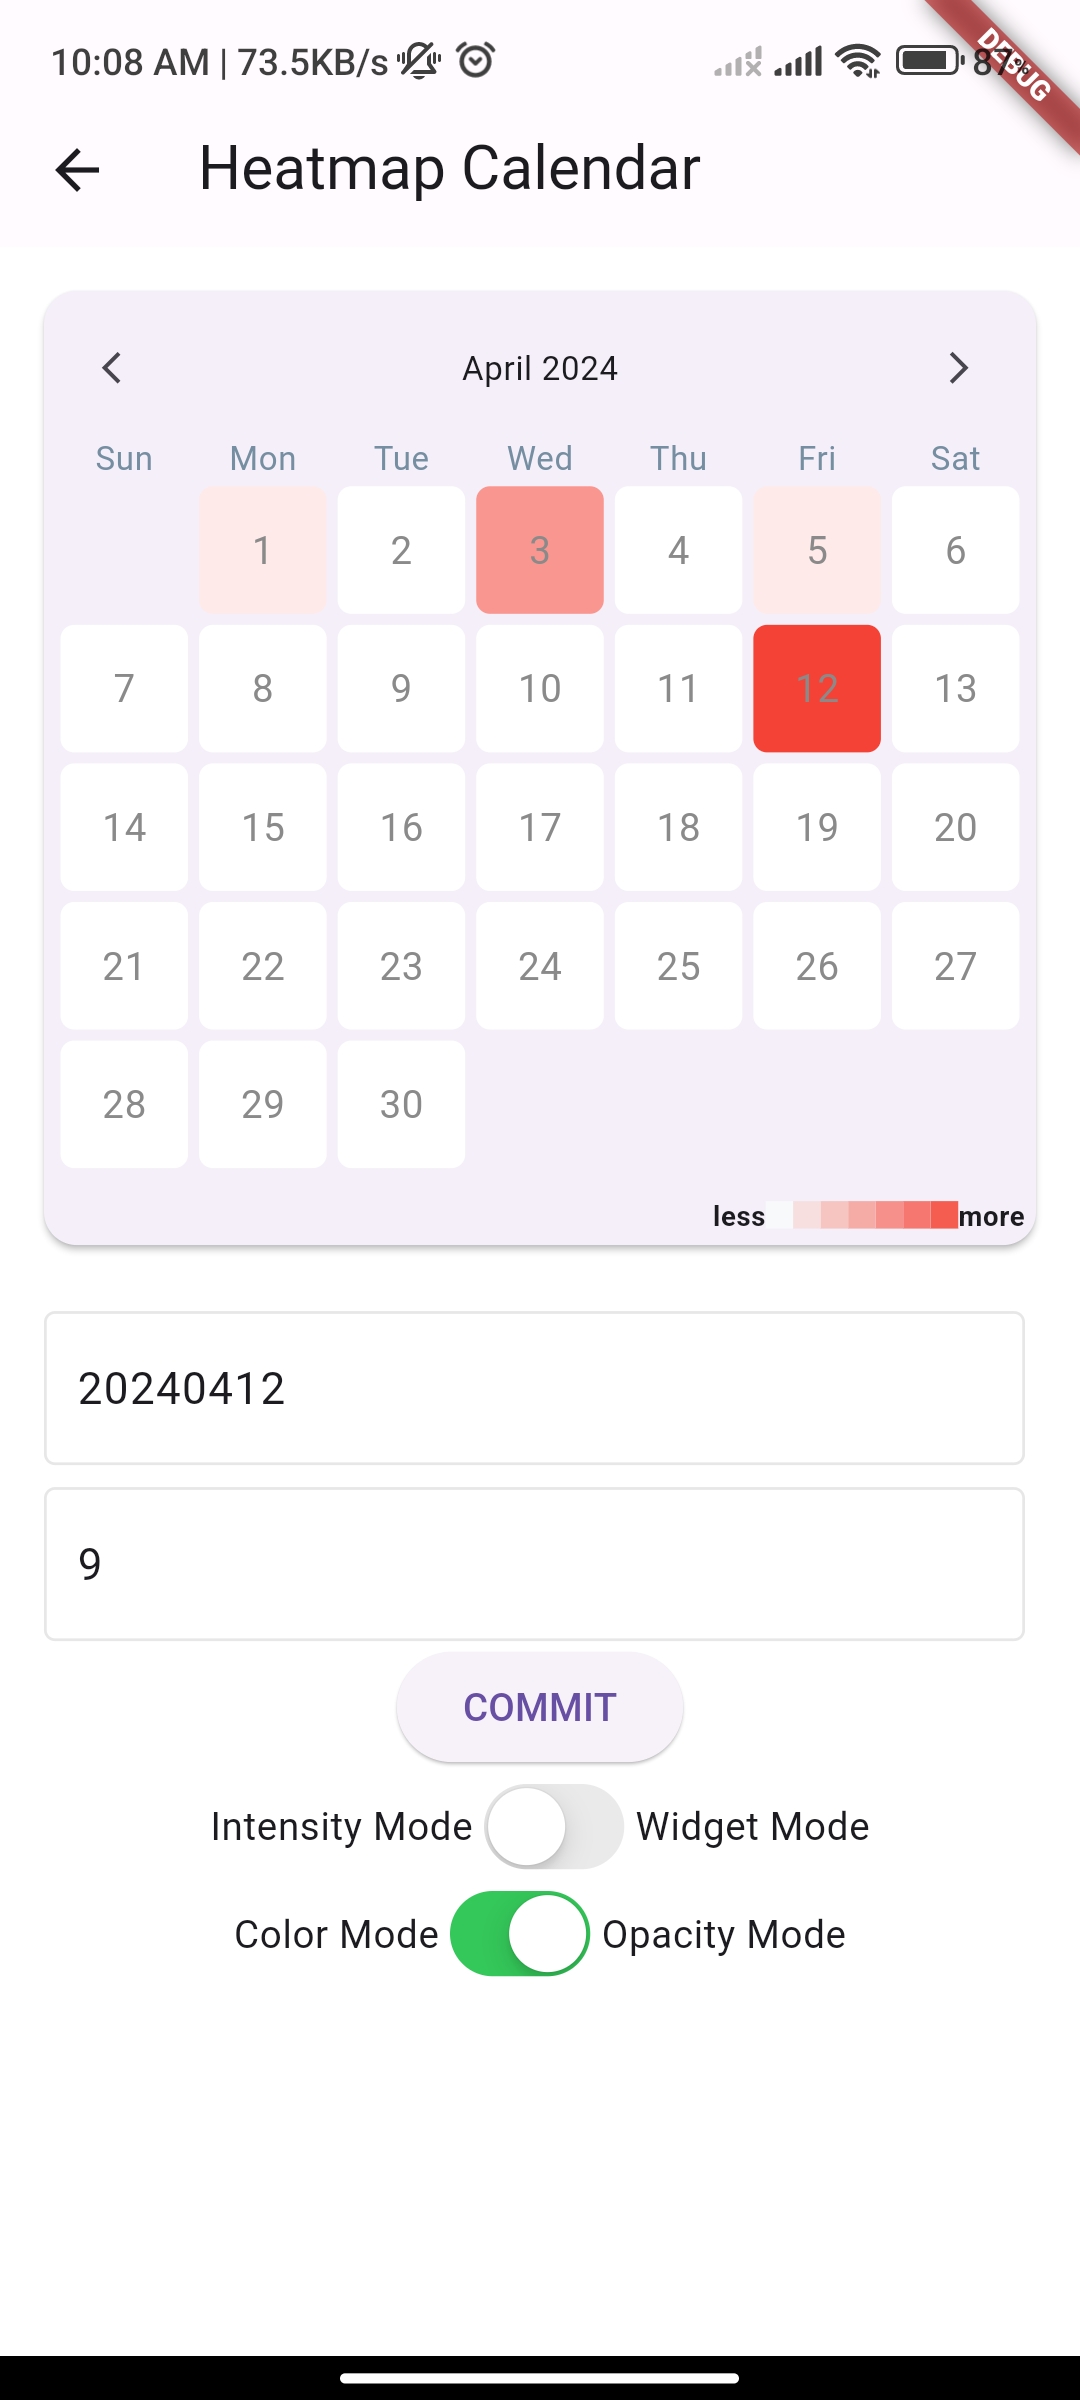
HeatMapCalendar: This component presents the data in a calendar format, again using a heatmap-style visualization. This allows for a more calendar-centric view of the data, making it easier to understand patterns and trends over time.
Both the HeatMap and HeatMapCalendar components in Heatmap Calendar Flutter are designed to be highly customizable. Developers can adjust the color palette, control the size and spacing of the cells, and even configure the data source to suit their specific use cases.
Heatmap Calendar Flutter is built on top of the Flutter framework, leveraging the platform's powerful UI rendering capabilities to deliver smooth and responsive visualizations. The package also benefits from the active Flutter community, ensuring ongoing support and updates to keep pace with the latest Flutter developments.
![Flutter heatmap calendar inspired by github contribution chart. [traditional mode / calendar mode]](/content/images/2021/12/Snipaste_2021-12-26_19-58-20.jpg)