geojson_vector_slicer
A flutter_map plugin to display fast geojson by slicing into tiles. Slicing based off https://github.com/mapbox/geojson-vt
IMPORTANT! This is an alpha/proof of concept version currently.
Getting Started
See the example main.dart, will create specific examples later.
Main features:
-
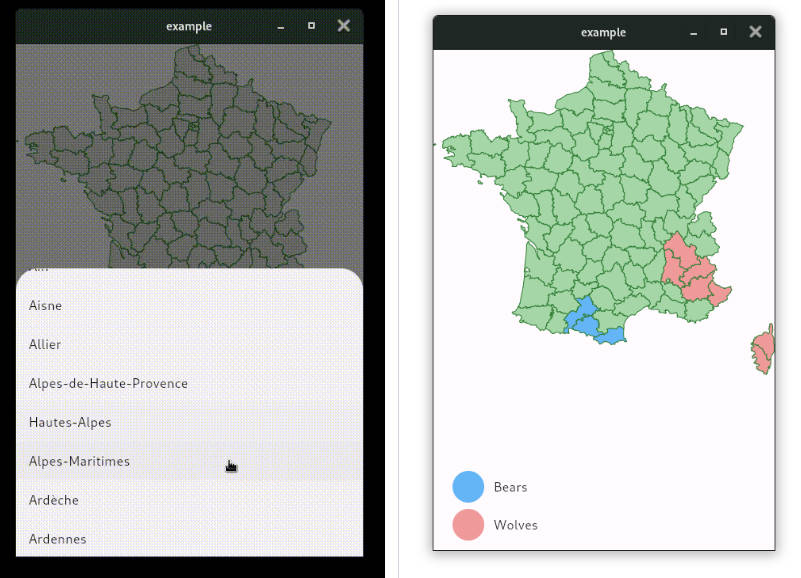
Display GeoJSON by splitting them into tiles (tiles are stored in an Index).
-
Line simplification on GeoJSON.
-
Polyline/polygon tap/hit detection code.
-
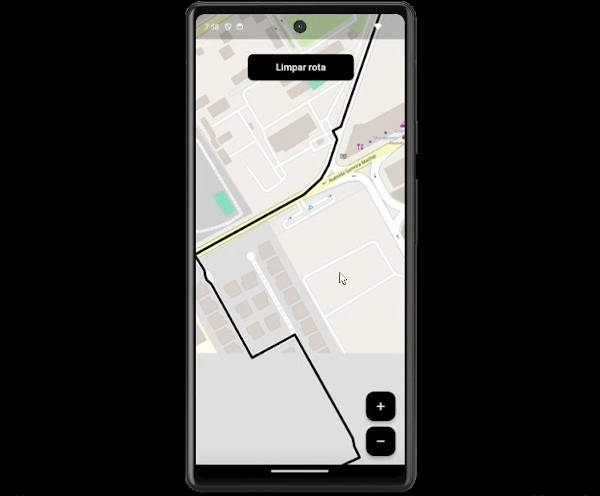
Can Display Vector tiles (no mapbox styling works on this or is intended to).
-
Can cluster markers (basic) based on tiles (no spiderfy features).
How it works
Tiles belong to an Index we create at first.
geoJsonIndex = await geoJSON.createIndex('assets/ids.json', tileSize: tileSize);
This creates an index, precalculates zoom 0-2 for performance (higher zooms are calculated on the fly)
Tile Index Options
{
  'maxZoom': 14,            // max zoom to preserve detail on
  'indexMaxZoom': 5,        // max zoom in the tile index
  'indexMaxPoints': 100000, // max number of points per tile in the tile index
  'tolerance': 3,           // simplification tolerance (higher means simpler)
  'extent': 4096,           // tile extent
  'buffer': 64,             // tile buffer on each side
  'lineMetrics': false,     // whether to calculate line metrics
  'promoteId': null,        // name of a feature property to be promoted to feature.id
  'generateId': false,      // whether to generate feature ids. Cannot be used with promoteId
  'debug': 2                // logging level (0, 1 or 2)
};
GeoJsonWidget options
index: Our index we created earlier.
options: our GeoJSONOptions (see below)
drawClusters: true to erm draw clusters instead of raw features.
drawFeatures: true to erm draw the features
(You probably only want one of these enabled, but you can have both enabled for testing).
featuresHaveSameStyle: true if all geometry has the same color. This may give a performance tweak as we can batch draw calls up
Available GeoJSONOptions are:
Function? lineStringFunc;
Function? lineStringStyle;
Function? polygonFunc;      // callback for polys
Function? polygonStyle;     // styling for polys
Function? pointFunc;        // marker/points, draw to canvas
Function? pointWidgetFunc;  // marker/points, show a widget
Function? pointStyle;       // marker/points styling
Function? overallStyleFunc; // one overall callback for a feature
Function? clusterFunc;      // call this if we're displaying a cluster
bool featuresHaveSameStyle; // performance improvement (maybe) if all features are the same
Example Widget
GeoJSONWidget(
  drawClusters: true,
  drawFeatures: false,
  index: geoJsonIndex,
  options: GeoJSONOptions(
    featuresHaveSameStyle: false,
    overallStyleFunc: (TileFeature feature) {
      var paint = Paint()
        ..style = PaintingStyle.stroke
        ..color = Colors.blue
        ..strokeWidth = 5
        ..isAntiAlias = false;
      if(feature.type == 3) { // lineString
        ///paint.style = PaintingStyle.fill;
      }
      return paint;
    },
    pointWidgetFunc: (TileFeature feature) {
      //return const Text("Point!", style: TextStyle(fontSize: 10));
      return const Icon(Icons.airplanemode_on);
    },
    pointStyle: (TileFeature feature) { return Paint(); },
    pointFunc: (TileFeature feature, Canvas canvas) {
      if(CustomImages.imageLoaded) {
        canvas.drawImage(CustomImages.plane, const Offset(0.0, 0.0), Paint());
      }
    },
    ///clusterFunc: () { return Text("Cluster"); },
    ///lineStringFunc: () { if(CustomImages.imageLoaded) return CustomImages.plane;}
    polygonFunc: null,
    polygonStyle: (feature) {
      var paint = Paint()
        ..style = PaintingStyle.fill
        ..color = Colors.red
        ..strokeWidth = 5
        ..isAntiAlias = false;

      if(feature.tags != null && "${feature.tags['NAME']}_${feature.tags['COUNTY']}" == featureSelected) {
        return paint;
      }
      paint.color = Colors.lightBlueAccent;
      return paint;
    }
  ),
Example Vector Tile Widget
      VectorTileWidgetStream(size: 256.0, index: vectorTileIndex,
                  options:   const {
                  'urlTemplate': 'https://api.mapbox.com/v4/mapbox.mapbox-streets-v8/{z}/{x}/{y}.mvt?mapbox://styles/<name>/<key/',
                  'subdomains': ['a', 'b', 'c']},
      ),
onTap for polygons
              onTap: (tapPosition, point) {
                featureSelected = null;
                // figure which tile we're on, then grab that tiles features to loop through
                // to find which feature the tap was on. Zoom 14 is kinda arbitrary here
                var pt = const Epsg3857().latLngToPoint(point, mapController.zoom.floorToDouble());
                var x = (pt.x / tileSize).floor();
                var y = (pt.y / tileSize).floor();
                var tile = geoJsonIndex.getTile(mapController.zoom.floor(), x, y);

                if(tile != null) {
                  for (var feature in tile.features) {
                    var polygonList = feature.geometry;

                    if (feature.type != 1) {
                      if(geoJSON.isGeoPointInPoly(pt, polygonList, size: tileSize)) {
                         infoText = "${feature.tags['NAME']}, ${feature.tags['NAME']} tapped";
                         if(feature.tags.containsKey('NAME')) {
                           featureSelected = "${feature.tags['NAME']}_${feature.tags['COUNTY']}";
                         }

                      }
                    }
                  }
                  if(featureSelected != null) {
                    print("Tapped $infoText $featureSelected");
                  }
                }
                setState(() {});
                },