Coming soon! See flutter/devtools#3951.
The text below is under construction.
Memory Leak Tracker
This is a framework for memory leak tracking for Dart and Flutter applications.
Quick start to track leaks for Flutter
Flutter application
- Before
runAppinvocation, enable leak tracking, and connect the Flutter memory allocation events:
import 'package:flutter/foundation.dart';
import 'package:leak_tracker/leak_tracker.dart';

...

enableLeakTracking();
MemoryAllocations.instance
      .addListener((ObjectEvent event) => dispatchObjectEvent(event.toMap()));
runApp(...
- Run the application in debug mode and watch for a leak related warnings. If you see a warning, open the link to investigate the leaks.
TODO(polina-c): implement the link and add example of the warning.
Flutter tests
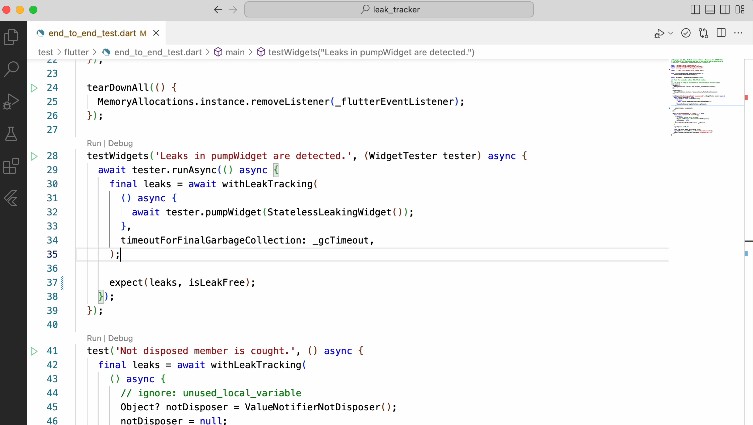
Wrap your tests with withLeakTracking to setup automated leak verification:
test('...', () async {
  final leaks = await withLeakTracking(
    () async {
      ...
    },
  );

  expect(leaks, leakFree);
});
How leak tracking works
Before reading about leak tracking, understand Dart memory concepts.
Addressed leak types
The leak tracker can catch only certain types of leaks, in particular, related to timing of disposal and garbage collection. With proper memory management, this tool assumes that, an object’s disposal and garbage collection occur in quick succession. That is, the object should be garbage collected during next garbage collection cycle after disposal.
By monitoring disposal and Garbage Collect events, the tool detects different types of leaks:
-
Not disposed, but GCed (not-disposed):
-
Definition: a disposable object was GCed, without being disposed first. This means that the object’s disposable content is using memory after the object is no longer needed.
-
Fix: invoke
dispose()for the object to free up the memory.
-
-
Disposed, but not GCed (not-GCed):
-
Definition: an object was disposed, but not GCed after certain number of GC events. This means that a reference to the object is preventing it from being garbage collected after it’s no longer needed.
-
Fix: To fix the leak, assign all reachable references of the object to null after disposal:
myField.dispose();
myField = null;
-
-
Disposed and GCed late (GCed-late):
-
Definition: an object was disposed and then GCed, but GC happened later than expected. This means the retaining path was holding the object in memory for some period, but then disappeared.
-
Fix: the same as for not-GCed
-
-
Disposed, but not GCed, without path (not-GCed-without-path):
-
Definition: an object was disposed and not GCed when expected, but retaining path is not detected, that means that the object will be most likely GCed in the next GC cycle, and the leak will convert to GCed-late leak.
-
Fix: please, create issue if you see this type of leaks, as it means something is wrong with the tool.
-
Culprits and victims
If you have a set of not-GCed objects, some of them (victims) might not be GC-ed because they are held by others (culprits). Normally, to fix the leaks, you need to only fix the culprits.
Victim: a leaked object, for which the tool could find another leaked object that, if fixed, would also fix the first leak.
Culprit: a leaked object that is not detected to be the victim of another object.
The tool detects which leaked objects are culprits, so you know where to focus.
For example, out of four not-GCed leaks on the following diagram, only one is the culprit, because, when the object is fixed and GCed, the victims it referenced will be also GCed:
   flowchart TD;
      l1[leak1\nculprit]
      l2[leak2\nvictim]
      l3[leak3\nvictim]
      l4[leak4\nvictim]
      l1-->l2;
      l1-->l3;
      l2-->l4;
      l3-->l4;
Limitations
By tracked classes
The leak tracker will catch leaks only for instrumented objects (See concepts for details).
However, the good news is:
-
Most disposable Flutter Framework classes include instrumentation. If how your Flutter app manages widgets results in leaks, Flutter will catch them.
-
If a leak involves at least one instrumented object, the leak will be caught and all other objects, even non-instrumented, will stop leaking as well.
See the instrumentation guidance.
By build mode
The leak tracker availability differs by build modes. See Dart build modes or Flutter build modes.
Dart development and Flutter debug
Leak tracking is fully available.
Flutter profile
Leak tracking is available, but MemoryAllocations that listens to Flutter instrumented objects, should be turned on if you want to track Flutter Framework objects.
Dart production and Flutter release
Leak tracking is disabled.
NOTE: If you are interested in enabling leak tracking for release mode, please, comment here.
Instrument your code
If you want to catch leaks for objects outside of Flutter Framework (that are already instrumented), you need to instrument them.
For each tracked object the library should get two signals from your code:
(1) the object is created and (2) the object is not in use.
It is most convenient to give the first signal in the constructor
and the second signal in the dispose method:
import 'package:leak_tracker/src/leak_tracker.dart';

class InstrumentedClass {
  InstrumentedClass() {
    dispatchObjectCreated(
      library: library,
      className: '$InstrumentedClass',
      object: this,
    );
  }

  static const library = 'package:my_package/lib/src/my_lib.dart';

  void dispose() {
    dispatchObjectDisposed(object: this);
  }
}
Start/stop leak tracking
To start leak tracking, invoke enableLeakTracking(),
to stop: disableLeakTracking().
TODO(polina-c): note that Flutter Framework enables leak tracking by default, when it is the case.
Collect leaks
There are two steps in leak collection: (1) get signal that leaks happened (leak summary) and (2) get details about the leaks.
By default, the leak tracker checks for leaks every second, and,
if there are some, outputs the
summary to console and sends it to DevTools. Then you can get
leak details either by
requesting them from DevTools or by invoking collectLeaks()
programmatically.
You can change the default behavior by passing customized
configuration
to enableLeakTracking():
- Disable regular leak checking and check the leaks by calling
checkLeaks(). - Disable output to console or to DevTools.
- Listen to the leaks with custom handler.
See DevTools > Memory > Leaks guidance on how to interact with leak tracker.
TODO: add link to DevTools documentation.
Troubleshoot leaks
Collect callstack
Stacktrace for the object’s lifecycle events may help to catch out the leak’s root cause. The lifecycle event will be creation for not-disposed leaks, and disposal for non-GCed leaks.
By default, the leak tracker does not collect stacktraces, because the collection may impact performance and memory footprint.
There are options to enable stacktrace collection for troubleshooting:
- By passing
stackTraceCollectionConfigtowithLeakTrackingorenableLeakTracking.
collect_callstack.mov
- Using interactive UI in DevTools > Memory > Leaks.
TODO: link DevTools documentation with explanation
Check retaining pathes
Open DevTools > Memory > Leaks, wait for not-GCed leaks to be caught, and click ‘Analyze and Download’.
TODO: add details
Performance impact
Memory
The Leak Tracker stores a small additional record for each tracked alive object and for each detected leak, that increases the memory footprint.
For the Gallery application
in profile mode on macos
the leak tracking increased memory footprint of the home page
by ~400 KB that is ~0.5% of
the total.
CPU
Leak tracking impacts CPU in two areas:
-
Per object tracking. Added ~0.05 of millisecond (~2.7%) to the total load time of Gallery home page in profile mode on
macos. -
Regular asynchronous analysis of the tracked objects. Took ~2.5 millisectonds for Gallery home page in profile mode on
macos.
